Consumer Complaints Dashboard
Here’s my take on visualizing the “Financial Consumer Complaints” dataset from Maven Analytics.
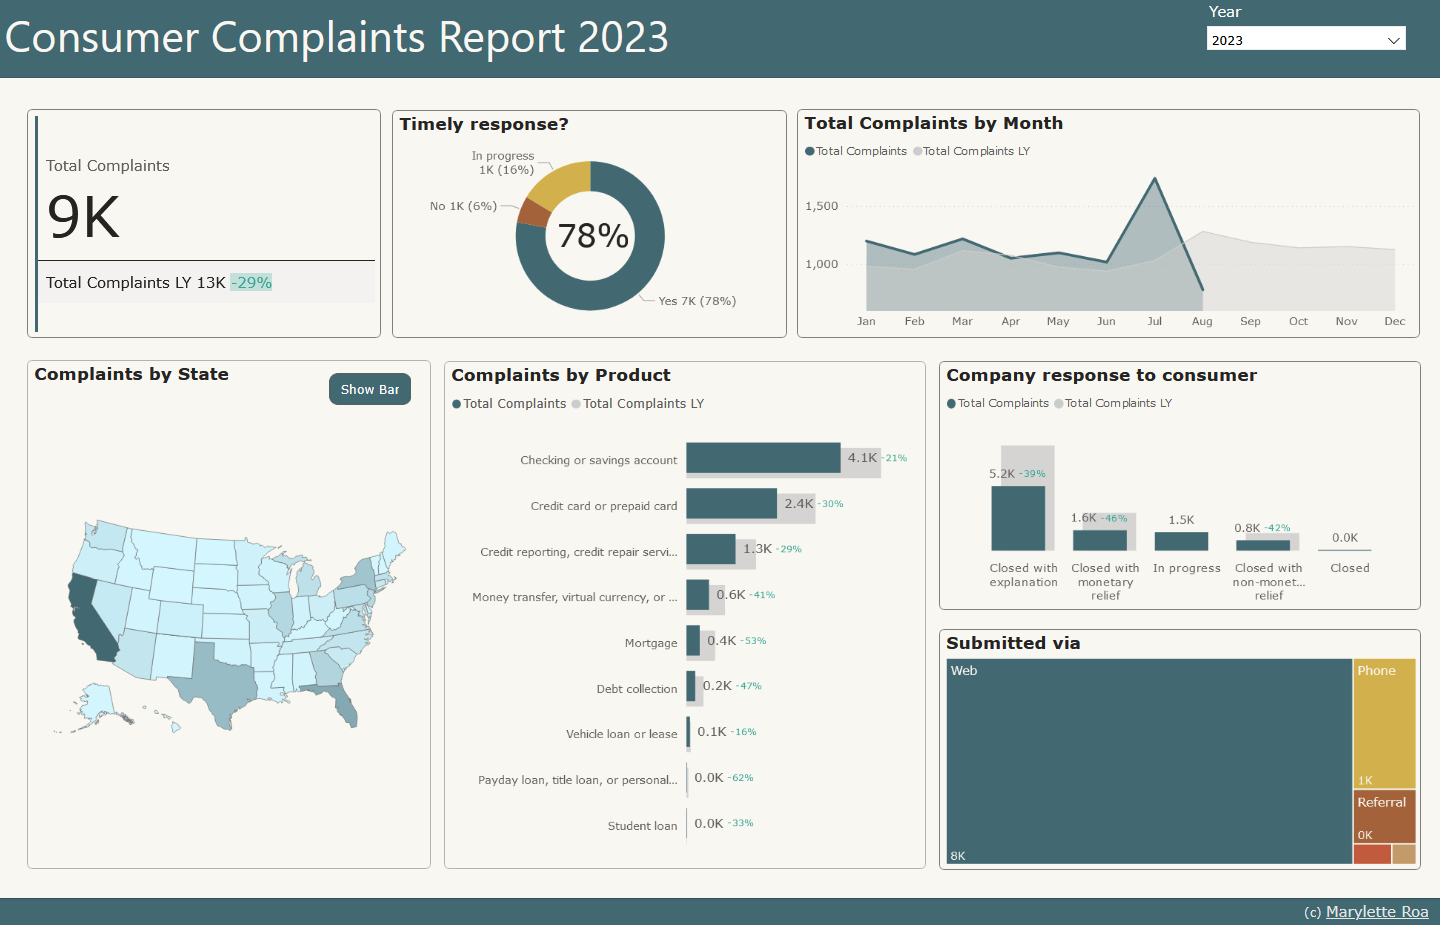
It’s a simple, straight-forward dashboard that shows the number of complaints by year, products, and states. The measures also include the number of complaints last year, and percent variance compared to the selected year as details.
For Complaints by Products, on-hover shows the breakdown of issues per product. The Complaints by State shows a map visual and a bar chart visual on toggle. The map visual demonstrates the use of the “shape map” feature in Power BI which is in preview mode (April 2024 version).
Overall, the total number of complaints do not look like they have a seasonal trend. A significant portion of the complaints were filed through web and most complaints were from California. Based on all records, “Checking or savings account” have the most number of issues with the most common issue being “Managing an account”. Complaints are typically resolved with explanation. Untimely responses consisted of only 4% of the total complaints. The year 2021 have the most number of complaints that were not resolved timely. The majority of these complaints were on credit and prepaid card transactions having problems with purchases shown in their statements.